

The State of Independent Investment Banking
Executive summary
Independent investment banking has a price, and it held. The median success fee signed by independent bankers on the Finalis platform over the past 5 quarters is 4.0%, on 1,575 engagement letters from 285 firms. Among the 88 firms active in both Q3 2025 and Q3 2026, M&A priced at 4.00% in both years on $30M mandates in both years, and capital raises moved exactly where the curve says a mandate growing from $15M to $25M should move. The fee compression that gets talked about shows up in platform-wide averages, which mix in firms that joined during the year. It doesn’t show up in the firms that were already here.
The spread is the story. The gap between the largest and smallest mandates on the Independent Fee Curve is 2.5 points, 5.0% to 2.5%. The gap between the 25th and 75th percentile inside a single size band is 2 to 3 points. A $15M mandate signed anywhere from 3% to 5.2% this year. Who signs at the top has little to do with deal size and a lot to do with deal type, sector and the firm. M&A letters land in the top quarter of their band 36% of the time and the bottom quarter 15%; secondaries, the reverse. Healthcare skews high; real estate and financial services skew low. Firms with 1 or 2 mandates land in the bottom quarter 36% to 39% of the time.
Pricing power is a firm attribute. A typical firm’s own letters sit within a point of each other, while firms differ from one another by 2 points. Firms price consistently; they just price differently. Retainers are part of that pricing: in M&A under $25M, letters with a retainer carry 90 to 200 bps less success fee, so the retainer is priced as a trade rather than an add-on. Firms new to the platform attach one half as often as established firms.
This is the first read on the lower-middle-market independent segment built from executed contracts. Over the 12 months to September 30, 2026, 308 independent investment banks on the platform signed 1,750 engagement letters representing $87.8B in mandated transaction value, across 45 countries. Capital raises account for 63% of that value and M&A for 28%; Energy & Utilities, with 7.5% of deals, carries 14% of the value. Every figure here reflects terms a banker and a client signed.
Analyst’s note. We built this report because the fee question comes up in nearly every conversation with an independent banker, and the only published answers were surveys. The curve below is what 1,575 signed letters say. It will be recomputed every quarter, and the second edition will be the first that can tell you what moved. [[Named analyst]], Finalis Insights
$87.8B in independent mandates signed on the platform in 12 months, across 1,750 engagement letters.
4.0% the median success fee, and unchanged year over year among established firms’ M&A mandates.
3 points the spread inside a single size band, larger than the gap between the smallest and largest deals.
Highlights
- The curve is monotonic: 5.0%, 4.0%, 3.5%, 3.0%, 2.5% from mandates under $10M to $100M+, on 146 to 529 letters per band, with no band moved by a single firm.
- Established firms held price. 88 firms active in both Q3s: M&A at 4.00% and $30M both years; capital raises grew from $15M to $25M and priced down the curve by 50 bps, within 10 bps of what the curve predicts.
- M&A prices 50 to 100 bps above capital raises at every size, and lands in the top quarter of its band more than twice as often as the bottom.
- Pricing is a firm attribute. Firms’ own letters vary by 0.5 to 1.0 points; firms differ from each other by 1.5 to 2.2 points. The spread of firm medians is 62% to 86% of the whole spread.
- Retainers are priced as a trade. In M&A under $25M, letters with a retainer carry 90 to 200 bps less success fee than letters without (5.0% vs 7.0%; 4.1% vs 5.0%). Firms new to the platform attach a retainer on 23% of deals; established firms, 41% to 47%.
- Energy & Utilities punches above its weight: 7.5% of deals, 14% of mandated value, a $30M median deal, and 36% of its letters in the top quarter of their band.
- Retainers are the majority position in M&A (62% of Q3 deals; 80% at firms running 11+ mandates) and roughly half as common on capital raises (35%).
- The book premium. Firms with 3 or more mandates sign at a median 4.00% with retainers on 38% to 44% of deals; firms with 1 or 2 sign at 3.00% to 3.25% with retainers on a quarter. Deal sizes are similar across groups.
- Healthcare holds a premium (37% of its letters in the top quarter; 5.0% at $10M to $25M vs 4.0% market). Technology tracks the market, then drops to 2.75% above $100M.
- International is a fifth of the market. Non-US mandates rose from 11.7% to 20.2% of letters with a known country; the UK and Canada lead.
- Secondaries tripled as a share of signed engagements, 2.7% to 8.2%. They price at the bottom of the curve: 3.0% median on a $3M median deal, 54% of letters in the bottom quarter of their band, and a retainer on 3% of deals.
Why this market matters
- Fees are moving to independents. Five publicly traded elite boutiques plus Centerview went from under 15% of US M&A advisory fees in 2018 to more than 27% in 2024 (Dealogic data, as reported [PR: primary source]). Independent advisors earned $6.0B in global M&A fees in 1H 2026, up 28% on 1H 2022 against 17% for all advisors (ION Analytics/Dealogic). That growth was concentrated at the top.
- The lower middle market is where the volume is. Deals with closing payments of $50M or less were more than 40% of transactions in SRS Acquiom’s dataset. Bulge brackets have largely left it. The median deal on this platform is $20M; the mean is $52.9M, pulled up by a small number of large mandates. The elite-boutique figures describe the top of the independent market. This report describes the part below it, where most of the deals are.
- The regulated infrastructure is shrinking. 3,184 FINRA-registered broker-dealers at the end of 2025, with 163 departures and 98 new entrants (FINRA 2026 Industry Snapshot). Demand for independence is growing while the number of places to hang a license falls.
1. The independent market on Finalis
Every mandate starts with an engagement letter. Closed-deal league tables report what happened; signed letters show what bankers were hired to do, months earlier. This section runs with the same table and chart in every edition.
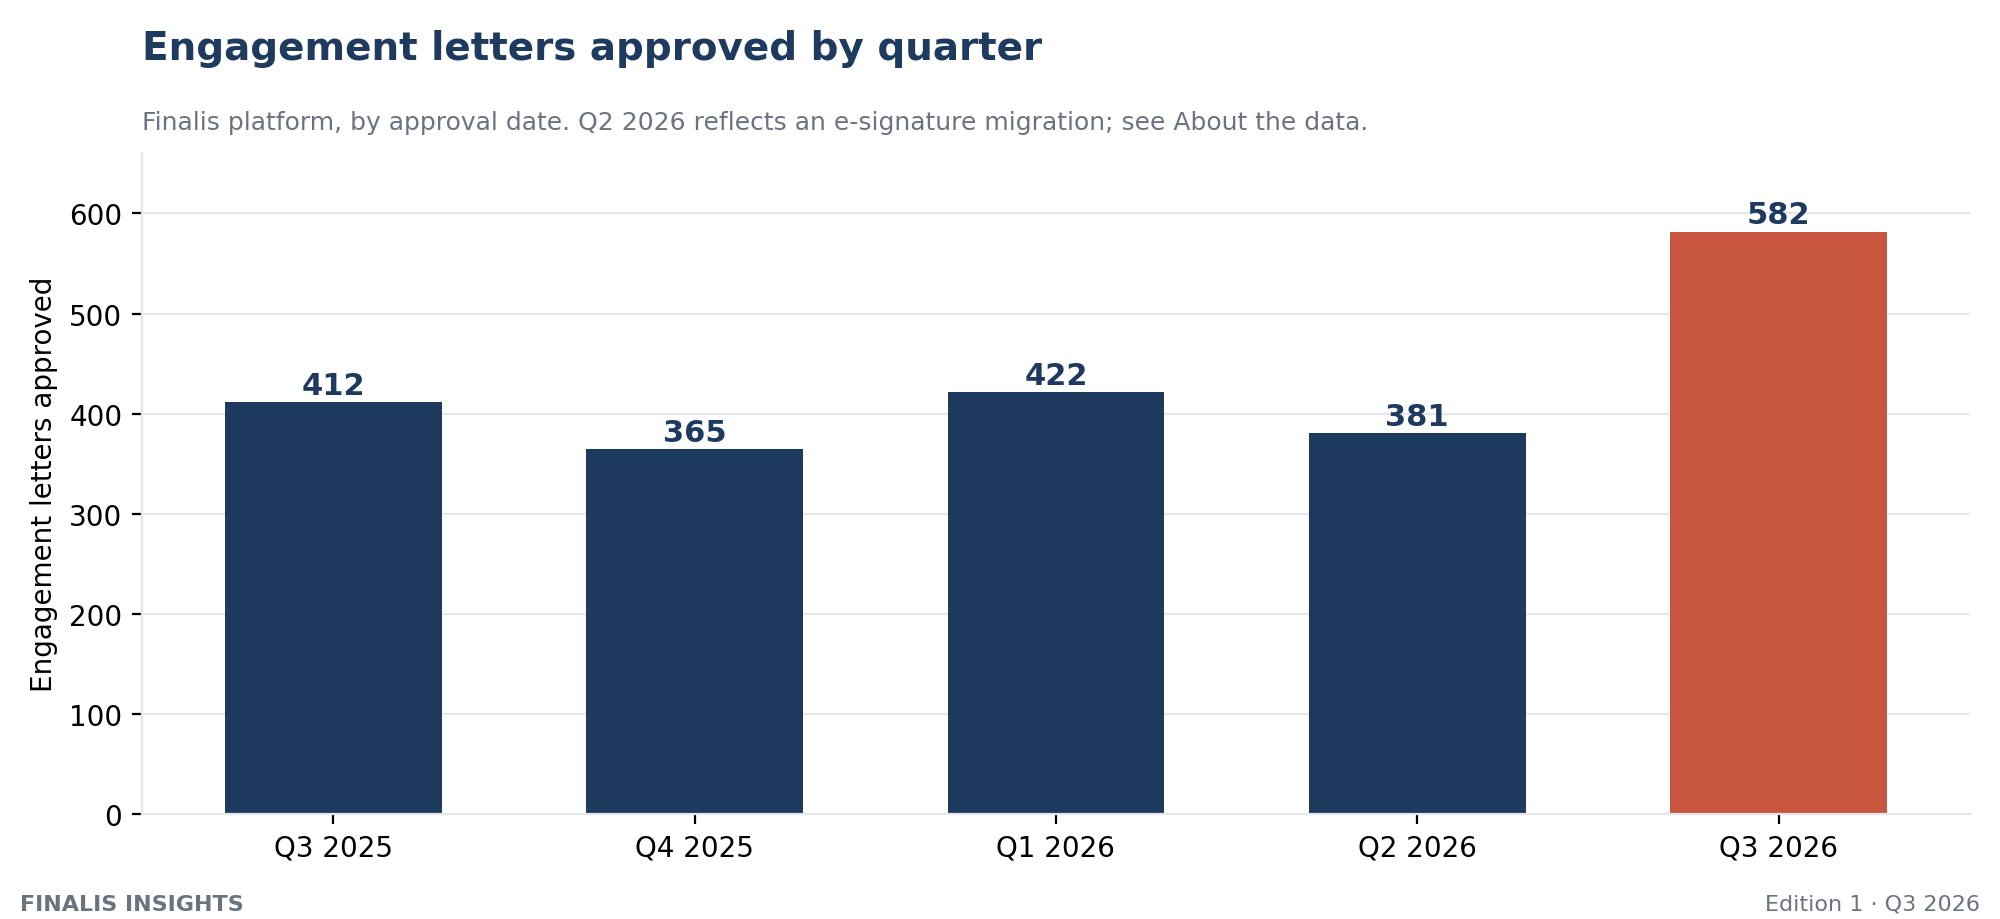
Letters approved ranged from 365 in Q4 2025 to 582 in Q3 2026, the highest quarter in the series. Among the 88 firms active in both Q3s, letters rose 9% year over year (262 to 285) and M&A letters 15% (79 to 91), so part of the growth is same-firm activity rather than new arrivals. This edition describes the series; what signed mandates say about future closings is the subject of the year-end Independent Dealmaker Index, January 2027.
Capital raises are the largest deal type, 54% to 68% of letters in every quarter; M&A ran 23% to 34%. Secondaries climbed from 2.7% (11 letters, below threshold) to 8.2%. By sector, Technology rose from 22.6% to 31.1% of letters; Real Estate fell from 14.3% to 8.6% and Industrials from 13.6% to 8.4%.